In almost every shop, a small group of items brings in most of the money. The rice, the oil and the tea pay the rent; the fortieth flavour of chips mostly takes up space. ABC analysis of inventory is a simple way to find out which items are which, so you can give your attention, cash and best shelves to the ones that earn it.
What ABC analysis is
ABC analysis sorts your items into three groups by how much they sell (or earn):
- A items: the few items that make most of your sales, often around 80% of sales from about 20% of items.
- B items: the steady middle, roughly the next 15% of sales.
- C items: the long tail, the many items that together make the last 5% or so.
The idea comes from the Pareto principle (the "80/20 rule"). Your own split won't be exactly 80/15/5, and it doesn't need to be: the point is to know your A items.
How to do an ABC analysis
- Take three months of sales by item. Three months smooths out a busy festival week. A billing app's reports give you this straight away; in BSMM, the best sellers for the period are the top of your list. Use sales value (quantity × selling price), not quantity: one sack of rice is worth more than ten sweets.
- Sort the items from highest sales to lowest.
- Work out each item's share of the total, and a running (cumulative) total.
- Draw the lines: A up to about 80% of the running total, B up to about 95%, and C for the rest.
A worked example
Take a small grocery with 200 items and Rs 5,00,000 of sales over three months. Its ten biggest sellers:
| Item | Sales (Rs) | Share of sales | Running total | Class |
|---|---|---|---|---|
| Basmati Rice 5 kg | 96,000 | 19.2% | 19.2% | A |
| Sunflower Oil 1 L | 72,000 | 14.4% | 33.6% | A |
| Sugar 1 kg | 52,000 | 10.4% | 44.0% | A |
| Tea Leaves 500 g | 40,000 | 8.0% | 52.0% | A |
| Fresh Milk 1 L | 36,000 | 7.2% | 59.2% | A |
| Instant Noodles | 28,000 | 5.6% | 64.8% | A |
| Glucose Biscuits | 24,000 | 4.8% | 69.6% | A |
| Cola 500 ml | 20,000 | 4.0% | 73.6% | A |
| Bath Soap | 18,000 | 3.6% | 77.2% | A |
| Iodised Salt 1 kg | 14,000 | 2.8% | 80.0% | A |
| The next 40 items | 75,000 | 15.0% | 95.0% | B |
| The other 150 items | 25,000 | 5.0% | 100% | C |
| All 200 items | 5,00,000 | 100% |
Ten items, 5% of the list, make 80% of the sales. Forty more make the next 15%, and the last 150 items together make just 5%. Those ten are the items this shop can never let run out.
Commerce textbooks rank by annual consumption value (units used × cost price). A shop can rank by sales value at selling price, as here, or by cost; just use the same one for every item.
What to do with each class
A items: never let them run out.
- Set a careful reorder level, with safety stock. See reorder level and reorder point.
- Count them every week.
- Compare supplier prices: a small saving here adds up.
- Give them easy-to-reach shelf space.
B items: keep them steady.
- Check stock and prices monthly.
- Use simple reorder levels.
C items: keep them small.
- Order in small quantities, even if the unit price is a little higher.
- Count them a few times a year.
- Ask whether each one earns its shelf. Some C items are worth keeping because customers expect them; others are on their way to becoming dead stock.
Advantages and limits
Advantages: it's quick, it needs only your sales records, and it tells you where a minute of attention or a rupee of cash does the most good.
Limits: it ranks by money, not by importance to customers (salt is a C item that every shop must still stock); it looks backwards, so a new or seasonal item can be misjudged; and the classes shift over time, so the analysis needs redoing.
Sales or profit?
Sales are the easiest to rank, but a shop lives on profit. Rice may top your sales and sit low on margin, while a household item sells half as much and earns more. If you can, run the same analysis on gross profit per item and compare the two lists: an item that's A for profit and C for sales deserves a better shelf. How to calculate your shop's real profit explains gross profit.
Related methods
- FSN analysis sorts items into fast-moving, slow-moving and non-moving, by how often they sell rather than how much money they bring.
- XYZ analysis sorts items by how steady their demand is: X sells evenly, Y varies, Z is unpredictable. Combined with ABC, an "AX" item (big and steady) is the easiest to plan.
- VED analysis (vital, essential, desirable) is used for spare parts and medicines, where running out of some items matters more than their value.
For a shop, ABC by sales and by profit covers most of what you need.
ABC analysis in an app
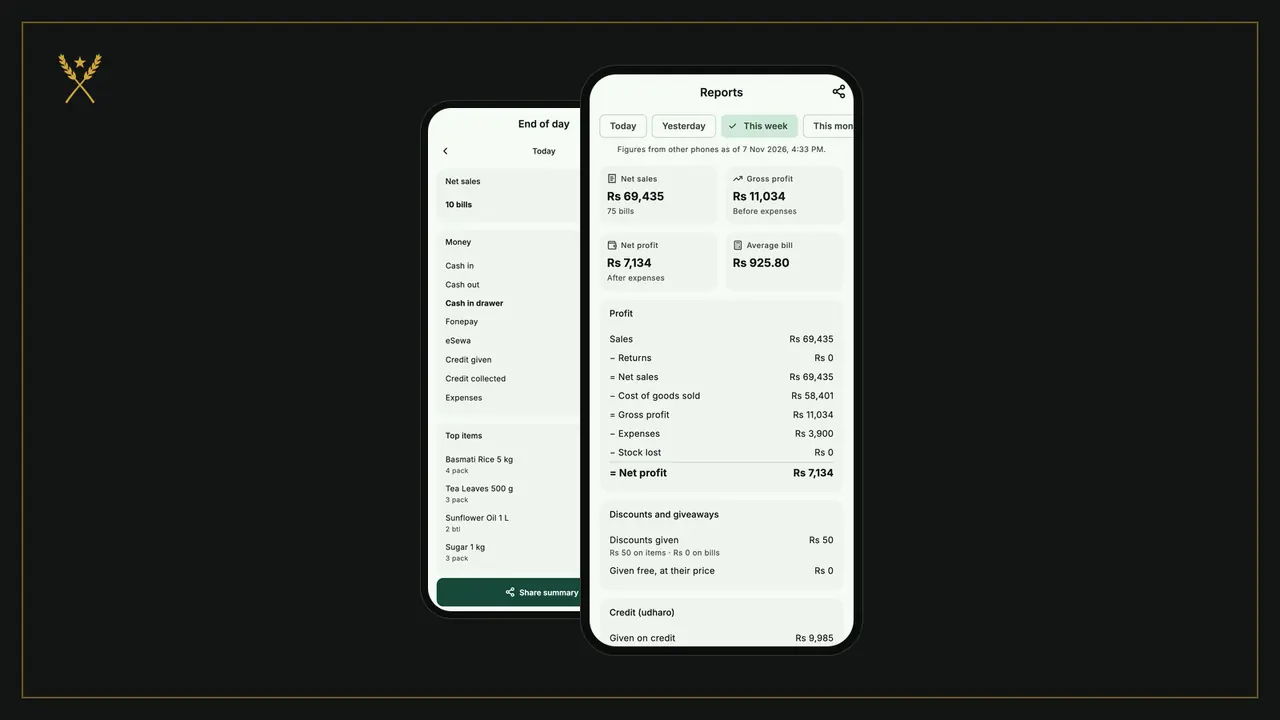
In a notebook, ABC analysis means adding up three months of sales by hand. In BSMM, the free stock and billing app for shops, the best sellers report shows your ten biggest sellers by sales value for any period you choose (Pick dates covers the last three months): the start of your A group. Each product also shows its margin and stock value, so the A items that earn the least are easy to spot.
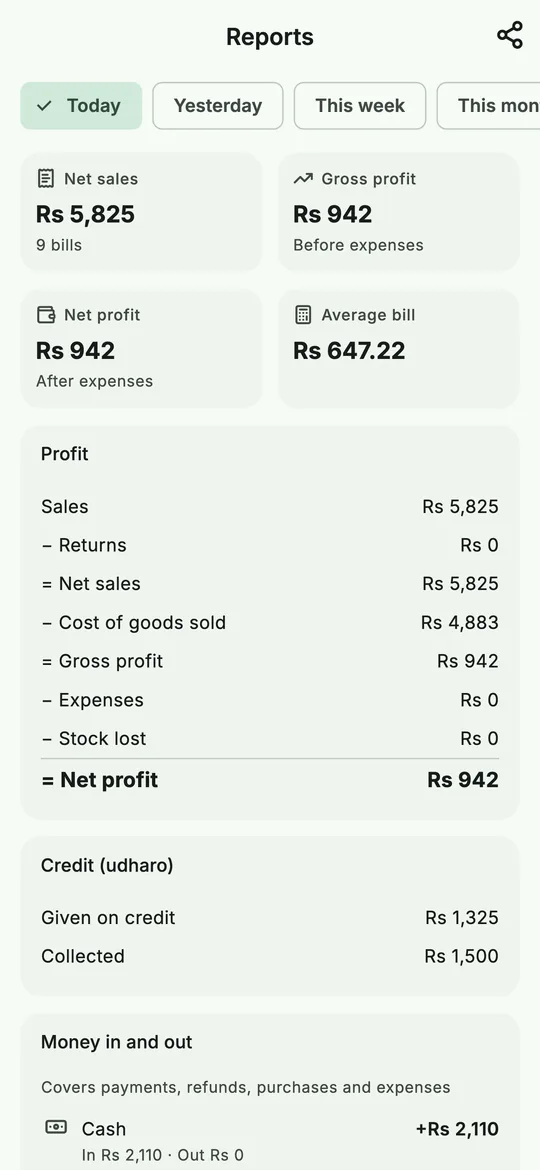 Reports for any period: profit at the top, your ten best sellers further down.
Questions shopkeepers ask
How often should I redo the ABC analysis? Every three to six months, and before the festival season, when what sells changes.
Is ABC analysis useful for a very small shop? Yes, even in its simplest form: knowing your top 20 items by sales, and checking them weekly, covers most of the benefit.
What's the difference between ABC analysis and the 80/20 rule? The 80/20 rule is the observation; ABC analysis is the method that puts it to work, with a third group in the middle.